Assignment 3:
xb Plane
by
Kristina Little
Assignment 3:
xb Plane
by
Kristina Little
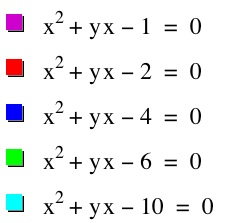
Take the basic quadractic equation:
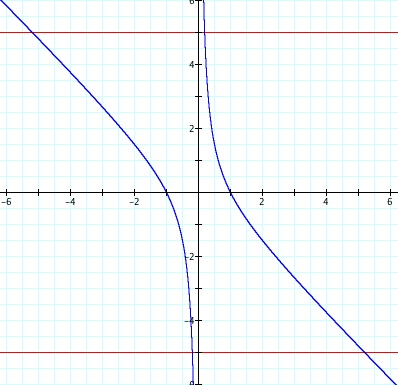
![]() where b is any real number. The graph to the right shows how the values of x and b relate to each other. Here the x values are along the x-axis and the b values are along the y-axis.
where b is any real number. The graph to the right shows how the values of x and b relate to each other. Here the x values are along the x-axis and the b values are along the y-axis.
Notice the gap between the two sections of the graph. Between -2 < b < 2, there are no values for this graph.
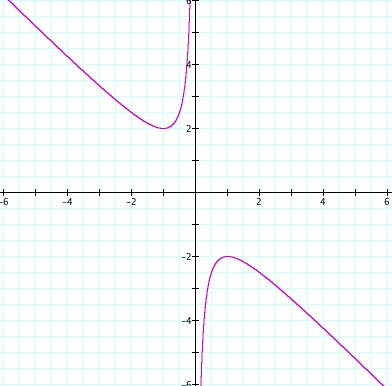
So let's explore these values. Overlay a graph such that b = k, where k is some constant real number. The graph to the right shows where b = -5 (in blue) and b = 5 (in red). Notice in particular the intersection points between our original graph and either one of the two constant graphs.
These points reflect the roots of the quadractic function at the specific values of b. You can go through the algebra of the quadractic equation to prove that these points will indeed show each root at a real b value.
When b = 2, our constant graph is now tangent to the xb graph. Here we are only able to find one real root. With our original function a quadractic, we are lead to believe that should always be two roots. Why is only one available when b = 2 (or -2)?
Now we will change our original function just slightly to see what these changes will illict.
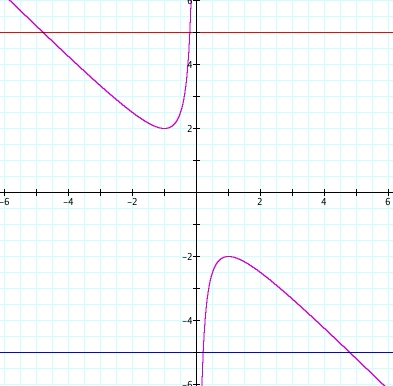
Take the new equation to be
![]() where b is again any real number. This new graph is depicted in blue against our original quadractic function and our two graphs of the constant b value. Notice which direction the graph is pointing. How would you describe in words the changes that have occurred?
where b is again any real number. This new graph is depicted in blue against our original quadractic function and our two graphs of the constant b value. Notice which direction the graph is pointing. How would you describe in words the changes that have occurred?
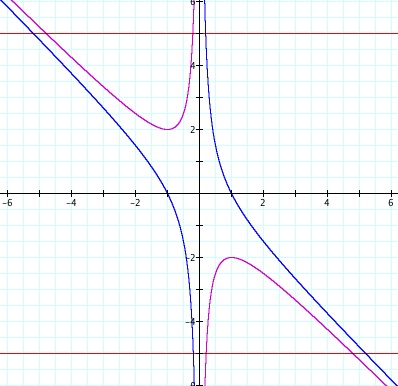
The graph at the right is now a less cluttered graph of our new function and the constant value of b. Knowing what we discusssed earlier about the significance of where the red graphs intersect with our graph, what would this new graph imply to you about the roots of our new equation?
Could you generalize and say confidently that this form of the equation will always have two roots regardless of the value of b? Is there anything one detail in the quaractic formula that would help us in our assertment of this idea?
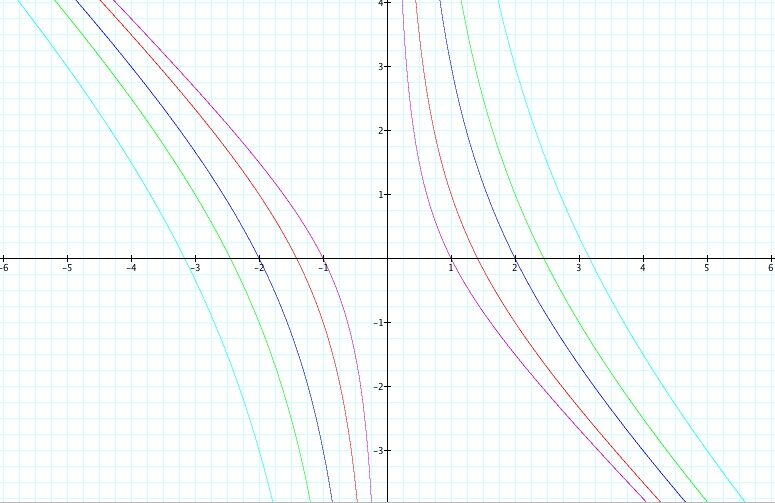
Let's see what the graphs look like as we let c < 0.
** where y=b here. |
 |
|---|---|
| Watch how as |c| becomes larger the graphs of xb move further away from the origin. But the realtive shape of the graph does not changes drastically. Do these graphs help facillitate or contradict our assumption that our new equation will always have 2 roots for any given value b as c < 0? |
Now, we can compare the two differences in c > 0 and c < 0 by watching the video below and specifically looking for significances as c varies between -5 < n < 0 and 0 < n < 5 against the line of c = 0.
Assignment 4: Take me to your Centroid